Market places are a lot powerful. They have taken our economy by storm through all different modes of how a marketplace works. From having the goods and services discovered to get them priced and finally delivered to the consumer, the marketplace makes it all happen with its immense happen.
From having the most advanced technological and digital items to the most basic food and a relaxing massage at home. And once liquidity is acquired, the strong network connections have their direct effect.
However, achieving that much liquidity and crossing transactions is no child’s play and is hard to achieve. We love marketplaces and at the same time also realize how difficult marketplaces are to build. We have acquired a deep respect for those who manage to make it happen. So, given here are some of the pointers that entrepreneurs can take into consideration.
It is made sure that no two marketplaces are equal. All are unique and different with their ideas and inspirations. For example, some businesses like Deliveroo enjoy high repeat rates, while on the other hand, others may benefit from high AOVs and suffer from low frequencies. Some invent an entirely new market like Airbnb, while others might be connective with the offline world like the Fateh. We’ll delve into in detail now about some things that they all might share in common. We’ll also highlight some of the KPIs that every entrepreneur aims to build a world-class marketplace.
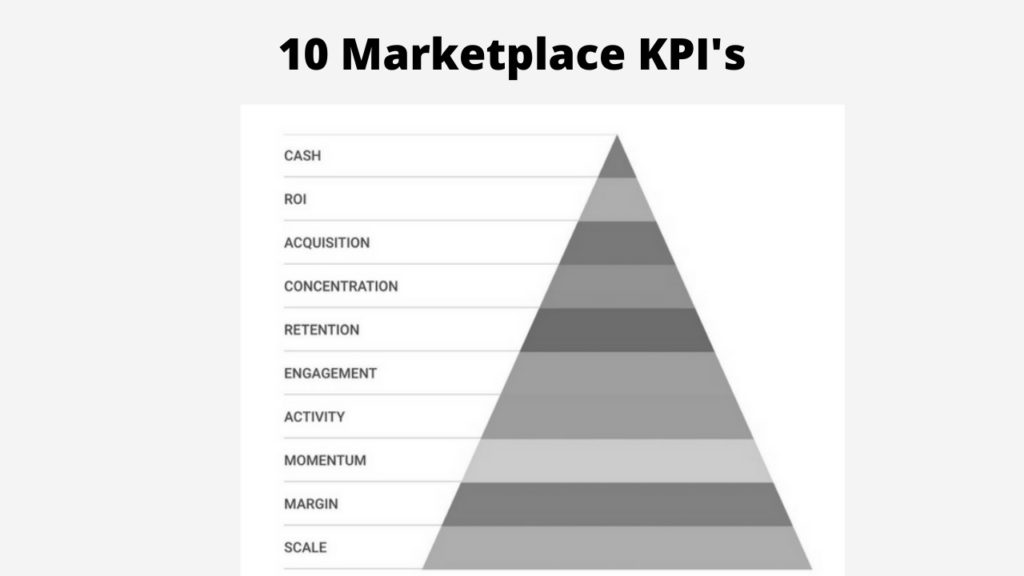
Scale
Gross Merchandise Value stands for the total cost value of goods or services sold on a platform. That is how the whole scale of the business is measured that is equivalent to Gross Revenue figures in e-commerce businesses. For services marketplaces, it is better to know the differentiation between contracted and delivered GMV figures.
The net value represents the actual revenue accumulated in the marketplace and managed by the take rate. It is the commission taken for each transaction, in a range of 10–30%. For different marketplaces, there are different take rates. So if your marketplace is an important distribution channel, you will be able to charge as much as 25%-30% take rate.
However, make sure that your sellers are economically well off. It’s giving and taking, where if they are satisfied, you are good to go.
Margin
Gross Margin – by subtracting the cost of the products or services (COGS) sold from net revenues. Another measurement for the take rate of the business is called Contribution Margin 1, by subtracting any other variable cost from GM like the payment costs, onboarding, data, etc. Next is Contribution Metric 2 – how much money you make after variable and acquisition costs from which also subtracts any sales and marketing costs like performance advertising, TV/radio/mail, PR campaigns, field/telesales.
It is unsurprising to see marketplaces with attractive gross margins but unattractive and sometimes even negative contribution margins that point to expensive customer acquisition, inefficient processes, or a lack of operational leverage. Since you need both sides of the marketplace to scale, do not forget to include seller acquisition costs in your contribution margin.
Momentum
Growth needs to be accompanied by unit economics and contribution margins.
Set in place the operations for continuing the smooth slope of growth in the future. For example, sometimes early-stage startups handle transactions in ways that are not automated so that they can fail first and learn fast. On the one hand, while this is encouraged and justified in short-run benefits, on the other hand, it is unforgiving in the long run, should be careful about no accumulation of undue amounts of operational debt.
Seasonality is for verticals that experience variations in business throughout the year like real estate, travel, and recruitment. In these cases, YoY figures prove more accurate than the MoM figures to gauge the growth.
Market Share- it’s necessary to monitor your relative position in the market as you gain more dominance. You can calculate market share by observing both traditional aspects and newcomer marketplaces.
More importantly, it’s necessary to identify cases of market expansion like Deliveroo or new market creations like BlaBlaCar. To get an accurate view, look at market share by geo/ vertical/ product so that you can see the segments in which you hold leadership by using a combination of traffic monitoring tools and downloading monitoring tools like AppAnnie.
Activity
Liquidity is the lifeline of any marketplace. You have accumulated buyers and sellers, next? Understandably, buyers and sellers interact with each other and a lot. Tracing the percentage of the items sold/booked and within what period in the marketplace is the best way to calculate the liquidity. The higher the percent and shorter the time is, you are bound to be in for more sellers making money and more buyers being your loyal customers.
Average order value is the metric to back up the bottoms-up market for your platform. More importantly, it’s a salient indicator of how much the marketplace makes from its customers with each other. Channel mix will vary based on AOV, on an acquisition front.
Engagement
In certain high AOV or free + premium marketplaces, the transaction might not happen as expected. Here messages between the buyers and sellers can play a driving force for bringing engagement on the platform for purchases. Frequent communication helps create a lock-in platform for both the buyers and sellers.
Net Promoter Score & User Reviews are necessary for determining whether the customers are:
→ delighted by the experience and have the intent to generate repeat orders
→ as advocates for your platform and recommend you to future customers, creating a viral loop virtually in the process.
If suppliers do not get enough quality business, they’ll likely turn to other platforms in the future. So reviews from suppliers are necessary.
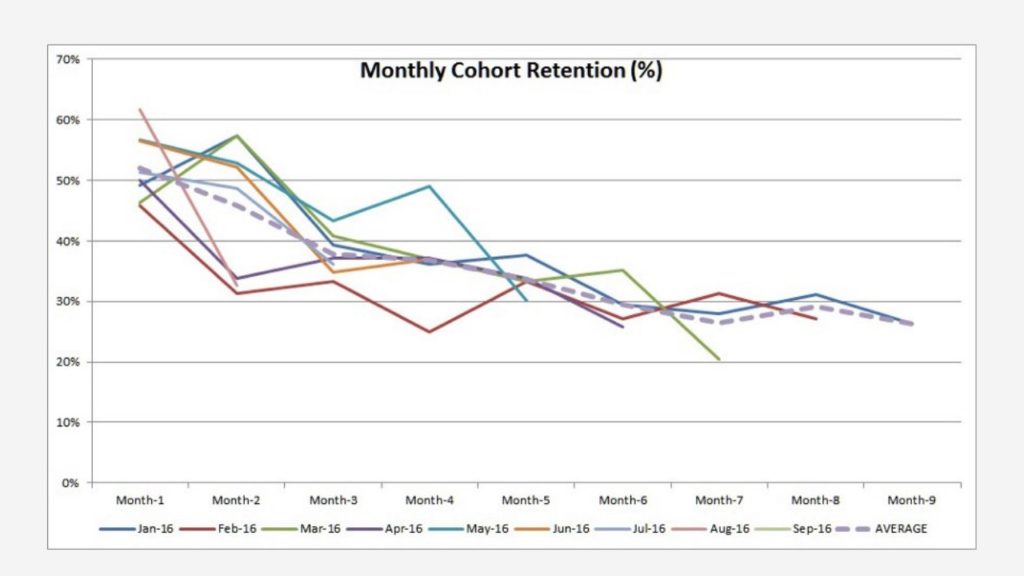
Retention
Cohorts show the continued activity of customers acquired. Monthly ones usually strike a balance between the ratio of information/noise and the ease of generation. The usual metrics that come in handy for running them are revenues, gross/contribution margin, or the number of orders. A way to portray them is on a percentage basis to remove the effects of recent cohorts and to visualize the long-term stabilization pattern.
We love marketplaces with strong retention rates. It is where customers are genuinely delighted, come back again and again, and helplessly can’t get enough of the product/service that the marketplace sells them.
Repeat Orders by running weighted averages on historical cohorts instead of simple means, which might hide repeat patterns. Cohort Consistency helps you in understanding your buyers and sellers even.
Concentration
A whale curve highlights the number of users, either on the buyer side or supply side. They represent plots and in-depth graphs of the number of customers versus the percentage of business generated over a particular period. For example, you could learn that your top 10 suppliers helped to drive 85% of sales last year and take the required steps towards increasing the supplier base in the future. In many marketplaces, there is an 80/20 rule. It means that 80% is the generated activity by 20% of the buyers or sellers.
In some extreme cases, it is possible for them to even cover up the outcome of your business by deterring the competitive suppliers on your platform. Potential acquirers of your company can be down the road. The concentration of Geo/Product highlights the underlying exposure of the business to several segments. It seems like a positive aspect because the focus is needed to serve a delightful customer experience.
But it can turn out bad if the areas generating the bulk of the business have limited upside and your company is impotent in increasing the space of higher segments of growth or product offerings. Fragmentation helps to add a second-order look to the distribution of activities in a marketplace. Is your marketplace a many-to-many platform or a few-to-many one? Many-to-many marketplaces bring the most value to a market and hence are best able to defend themselves from disinter-mediation.
Acquisition
Cost Per Acquisition, also known as CPA or Customer Acquisition Cost, also known as CAC – is a number you should know by heart. Your whole marketplace economics depends on it.
It’s to understand all funnel conversion stages from led to visit sign-up to purchase. After all, you ultimately only care about the users who transact. CPAs calculation includes the supply and buyer side with all S&M expenses, above-the-line media, and staff.
Channel Scalability in a way is that:
If you raised your capital by the next day, then which channels would you be investing this money in while also maintaining:
→ CPAs
→ The quality of acquired customers.
The first can be monitored by plotting the changes in CPAs by them. The latter is trickier to measure. Because when companies scale, they start bringing low-quality users.
Since not all cohorts are equal, they need to monitor carefully and individually. Here are some key lessons:
Avoid an immense dependency on a single channel. It can turn against you. It might be possible that the one you are relying on is not up to that required scale.
To understand the concept of whether different channels generate new users at similar costs and with similar ROI or not, relate channel breakdown with CPAs and retention.
More is the organic traffic is present, the better.
We advise you to think out of the box as much as possible to bring out new ideas. Traditional channels are also likely to be expensive even though they are essential. Get the suppliers to do the marketing for you because they bring about customers to your platform for online engagement that might otherwise not have been possible.
ROI
Lifetime Value also referred to as LTV, points to the expected value a buyer or supplier can generate on the platform over their lifetime. You’d generally need to compute LTV on a 1-to-3 year time frame, with the basis of contribution margin. LTV is the ROI generated by acquiring incremental user benchmarks for various verticals that exist should typically desire a greater than 1 to 1.5X 1-year LTV/CAC and a greater than 3X 3-year LTV/CAC on a contribution margin basis. Note that this metric is inversely co-related to the payback time required to get back your CPA.
Start with AOV, and subtract the cost per transaction associated with that order and any other associated variable costs, such as customer service. You require positive unit economics to have a long-term business.
Cash
Burn Rate. Diligently and carefully monitoring burn rate and fundraising needs is crucial, as ‘spend to gain market share has become a feat in verticals.
All commerce companies stay or die by their numbers. Details, details, and details! Marketplace founders are required to trace these KPIs and build them to get them automatically.
One of the most common and important reasons for failure in marketplaces is that either the supply or demand gets neglected as the business becomes one way concentrated, either demand-constrained or supply-constrained. Entrepreneurs may drive on one side of the marketplace hard and not pay enough attention to the actual liquidity. A numbers-driven founding team combined with a strong BI backbone and an experienced board will help startups successfully manage these challenges and become great marketplace rulers.