
How to choose the right UX metrics for your product?
You may evaluate usage statistics for your product and compare different interfaces in A/B testing while designing for the web.
It’s critical to employ the correct measurements to make this work in practice. It is easy to analyze basic traffic metrics (such as total page views or unique users) regarding your site’s performance. However, those basic metrics are not sufficient for assessing the impact of UX changes. Because they are so broad, they rarely relate directly to user experience or project goals – making them tricky to implement.
We’ve devised a few practical tools to aid in the selection and definition of acceptable metrics that reflect:
- The user experience’s quality (the HEART framework)
- Your product’s or project’s objectives (the Goals-Signals-Metrics process)
The HEART framework
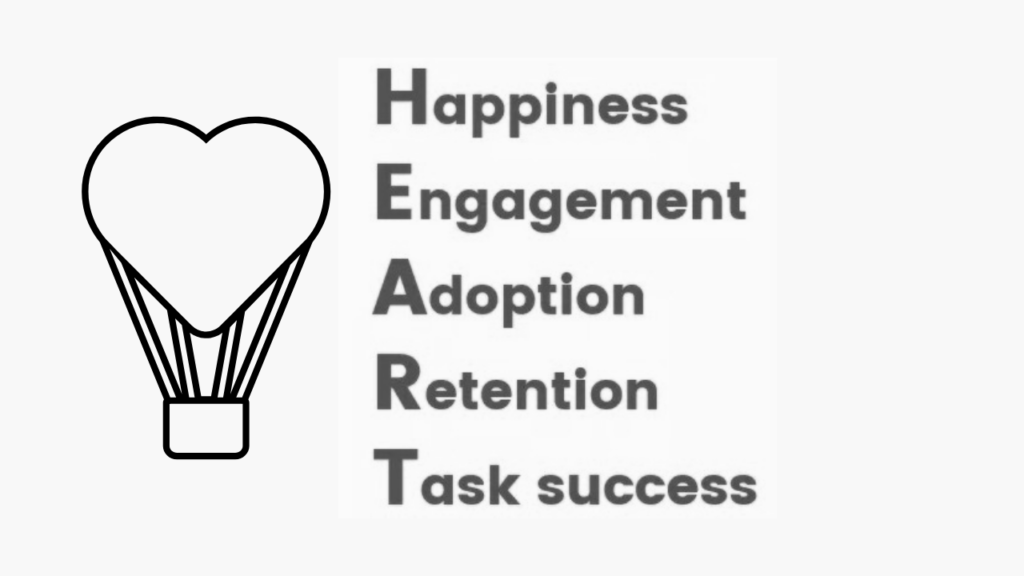
UX metrics fall into five categories:
Happiness
A measure of a user’s feelings is frequently gathered through a survey. Satisfaction, perceived ease of use, and net-promoter score are some examples.
Engagement
The degree to which a user is involved, as assessed by behavioral proxies such as frequency, intensity, or depth of engagement during a set period. The number of visits per user per week or the number of photos posted per user are two examples.
Adoption
New users of a product or feature are referred to as adoption, for example, the percentage of Gmail users that use labels or the number of accounts created in the last seven days.
Retention
It is the percentage of existing users who return. For instance, how many active users from one period are still active in a subsequent period? Failure to retain, sometimes known as “churn,” may be of greater interest to you.
Task Success
Traditional user experiences behavioral measures including efficiency (e.g., time to complete a task), effectiveness (e.g., percent of activities completed), and mistake rate. This category is best suited to task-oriented portions of your product, such as search or an upload flow.
These can be implemented at several levels, ranging from the entire product to a single feature. For example, in Gmail, we may be interested in product adoption in general and essential features, such as labeling and archiving.
It’s critical to keep track of how many users you had throughout a certain period (e.g., seven-day active users). However, if you also track adoption and retention, you’ll be able to tell how quickly your user base is increasing or stabilizing. It is because you’ll be able to tell the difference between new and returning users. It is helpful for new goods and features, as well as the redesigned ones.
Instead of generating metrics for all these areas, you should focus only on the most important ones (see the Goals-Signals-Metrics process in the next section).
The Goal-Signals-Metrics Process
Goals
It’s easy to begin thinking about metrics by making a lengthy list, but this can rapidly become overwhelming and difficult to prioritize. Focus on a small number of critical indicators that are important to everyone on the team.
To figure out what they are, start at the top: establish your objectives so you can choose metrics that will help you track your progress toward them. It’s amazing how difficult it is to describe a project’s aims, and here is where the HEART categories come in handy.
Defining your goals in terms of your existing KPIs is a classic problem – “hey, our goal is to boost visitors to our site.” Yes, everyone wants to do it, but how would improving the user experience help? Do you want to increase the engagement of your current users or attract new ones?
You might not know it, but different members of your team have varied perspectives on the project’s objectives. This procedure allows you to get an agreement on where you want to go.
Signals
After that, map your objectives to lower-level signals. How might user behavior or attitudes be affected by success or failure in achieving the goals?
For any given goal, there are usually a huge number of potentially effective signals. After you’ve come up with a few good possibilities, you might want to take a break and do some research or analysis to assist you to decide.
First, how easy, or difficult is it to track each signal? Is your product, or could it be, set up to log the required actions? Is it possible for you to conduct an in-product survey regularly?
Second, select signals that you anticipate being responsive to changes in your design. If you already have data on potentially relevant signals, you can evaluate it to see which ones appear to be the most accurate predictors of the linked goal.
Metrics
Once you’ve decided on signals, you may further refine them into metrics that you can watch over time or compare in an A/B test. The specifics at this point are highly dependent on your specific infrastructure.
However, like with the previous stage, there may be a plethora of metrics you can get from a given signal; you’ll need to do some analysis of the data you’ve previously gathered to determine which is the most appropriate. To make raw counts more useful, you’ll usually need to normalize them, for example, by using averages or percentages.
Conclusion
Therefore, the framework complements traditional methods and research tools and offers you ways to measure large-scale user attitudes and behavior.
Nevertheless, the framework cannot be the only source of information about a user. Traditional research still provides you with full insight into user feelings and interactions with metrics and results.
By implementing the HEART framework, you can observe how changes are implemented. Additionally, it improves the decision-making process. To provide accurate analysis criteria, it is critically important to identify key product aspects.
Thus, setting the framework requires several iterations to debug problematic areas and modify the tools and methods for testing users’ behavior. However, the combination of user experience goals and metrics allows you to incorporate hypotheses concerning the growth of the product into your testing process.