How To Use Twitter Analytics to Improve Your Posts
If you want to improve your social media game, you need to learn – how to use Twitter analytics.
The Twitter analytics and data available to you will help you identify influential content, effective marketing campaigns, and better customer services. These easily accessible and understandable Twitter analytics can assist you in creating effective social media strategies for your Twitter account.
In this blog, you will learn how to manage Twitter analytics and use them to post better tweets.
Before diving into the nooks and crooks of Twitter Analytics for improving your tweets, let’s understand all the metrics that you can track through Twitter analytics.

Which Twitter metrics can you track?
To understand how Twitter analytics work, you need to understand its jargon first. So, here are some essential metrics that you need to know to comprehend your Twitter analytics.
1. Impressions: This metrics shows how far your tweet has reached. These are the total number of times that your tweet has appeared on the timelines of the users. Your impression increases as your tweet get more likes and shares.
2. Reach: This metric suggests the number of users that might have seen your post. These users include both your followers and non-followers.
3. Engagement: Engagement means a user’s interaction with your tweet. This interaction could be like, react, share, comment, retweet, etc.
4. Engagement rate: This metric shows how actively your tweets are engaging with your audience. Twitter engagement is calculated by taking the total number of engagements, dividing it by impressions, and then multiplying it by a hundred.
10 ways how Twitter analytics will help you tweet better

The following points will show you how to use Twitter insights to devise better strategies for your Twitter handle.
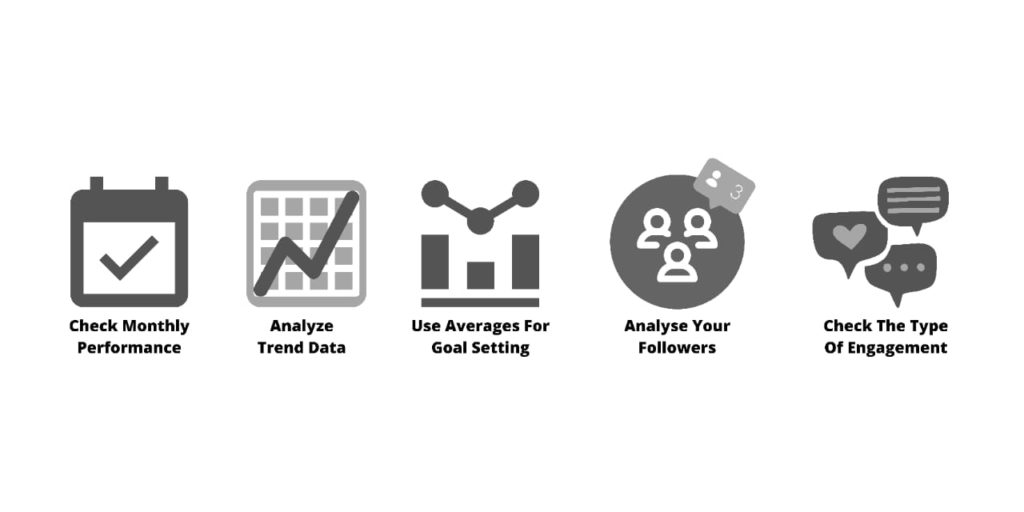
1. Check Monthly Performance
Twitter provides a monthly report of your account. It appears on your Twitter dashboard, where you can also check Twitter summaries of your previous months. It provides a quick overview of your Twitter performance. This dashboard includes the tweet highlights like your top-performing tweets, top mentions, follower count, top card tweet, etc
The above insights are essential in planning your tweet content for further reach and impressions. For eg. You can reshare the top-performing tweet with a new copy.
Your monthly stats are readily available on the right side of your Twitter account. This section shows some of the key metrics of your Twitter handle like impressions, reach, profile visits, etc.
2. Analyze Trend Data
Sometimes while monitoring the day-to-day activities of your Twitter analytics, you can lose track of the bigger picture. Monitor the trend of your Twitter account to check if your strategies are working out in the long term or not.
Through graphical representation, check if it is upwards or flat.
By identifying the trends of your Twitter performance, you will be able to devise better strategies for your Twitter handle. On the graphs, you get major metrics such as clicks, likes, and shares. You can compare these stats with the previous period to check the overall trends of your social media.
3. Use Averages for goal-setting
You’ll see many fluctuations on the graph while checking your Twitter trends. It can be difficult to compare the performances of such metrics. An easy solution for such complicated stats is Averages.
Comparing daily Twitter stats with the stats of the previous months can be a bit complicated. Averages would make the comparison part easy for you. You can see the average tweet performance on your Twitter dashboard. Compare the average tweet performance of this month with the previous month and check if your strategies are working out well.
Use these averages to set the next goal for your Twitter Handle and consistently monitor them with the help of Twitter Analytics.
4. Analyze your followers
There is a lot to Twitter Analytics. One of the main functions of Twitter Analytics is followers analysis. Twitter shows you the top 10 interests of your followers.
These interests can help you a lot in identifying ideas and creating content. It is one of the best ways of keeping your audience engaged with your account.
Where to find the top ten interests of your followers: Visit analytics.twitter.com. Click on Menu at the top of your page and go to Audiences. You’ll see Interests on the main followers dashboard.
5. Check the type of engagement
A higher number of engagement rate on two posts does not mean both of them performed the same. The type of engagement shows how one tweet performs better than the other even when the engagement rate is the same. There are basically two engagement types that you need to check: Retweets and Likes.
Likes: Likes are like a virtual high-five to you by any other Twitter user. When anyone likes your post, it means that they have appreciated that post.
Retweet: People retweet any tweet when they find it valuable enough to reshare with their audience.
You can get the breakdown of your Twitter engagement easily on your Twitter analytics dashboard. On the top navigation of your Twitter dashboard, click on ‘Tweets’ and then on ‘view tweet activity’ for any tweet displayed on the page.
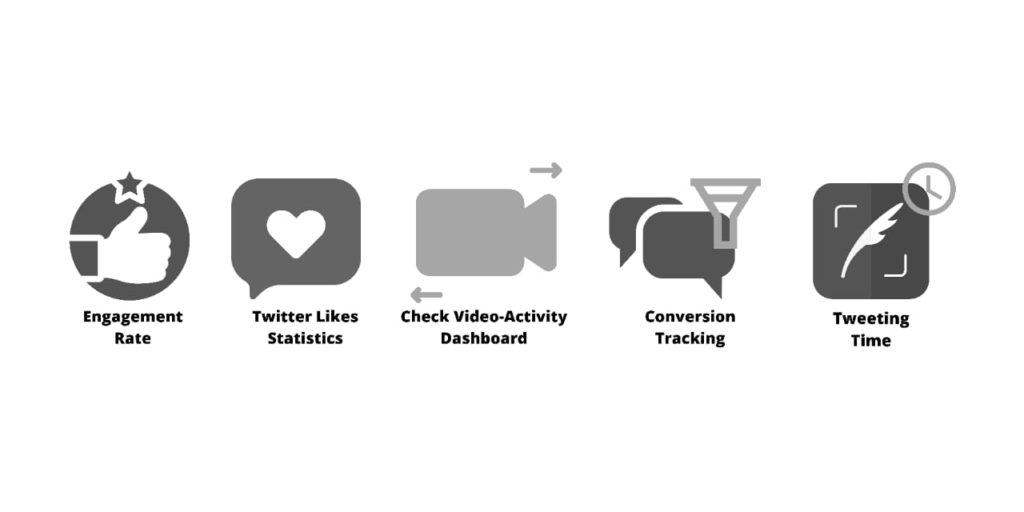
6. Engagement Rate
Engagement rate is a crucial metric as it helps you find out the number of engagements divided by impressions.
In simpler words, how many people interacted with your post from all the people that saw it. The higher engagement rate means the quality of your content is high and people are enjoying your posts. Twitter counts an engagement when the user clicks on Like. shares, comments, retweets, follows favorites, links, embedded media, username, profile photo, hashtags, and tweet expansion.
You can see these metrics in the exported data section of your Twitter Analytics.
7. Twitter Likes Statistics
It is a very simple and direct way of analyzing your tweet performance. More Tweet likes mean your content resonates with more Twitter users.
There are many reasons why a user would like your tweet. One of them is your users like the concept or idea you expressed in a tweet. Like rate helps filter the best concept or idea from all the ideas that people share on the platform.
Dan Shure, a leading SEO Consultant said, “For Twitter, it’s probably safe to assume that tweets that people have favorite would make for good article, blog posts, tools, ideas – because your audience has told you they like the idea with their engagement. At the least, the contents of those tweets for some reason got their attention.”
How to find the like rate of your post: Divide likes o your tweet by impressions and multiply by 100, you’ll get your like rate.
8. Check Video-activity Dashboard
Videos are acquiring more and more space on all social media platforms. Users would engage more with a tweet assisted by a video. Checking your Video-activity dashboard will help you create better strategies for your video content.
To reach the video-activity dashboard, Visit your Twitter Dashboard, Click on ‘More’ and select ‘Videos’ from the dropdown.
This dashboard only shows metrics for videos published through Twitter Media Studio and Twitter Ads.
Stats that you can analyze on the Video-activity dashboard are video views, video completion rate, Total minutes of video viewed, and Video retention.
9. Conversion Tracking
If you are a brand or a social media marketer, these metrics might be useful to you. Twitter Analytics dashboard includes the conversion tracking dashboard. It helps you measure your return on ad spend by tracking the engagement and impressions on your sponsored posts.
This dashboard shows the conversion rate of their tweets in the form of engagement, installs, link clicks, sign-ups, and purchases. If you’re paying for publishing ads on Twitter, this metric is highly essential to you.
If you set up a website tag on your Twitter profile, you can access website conversion tracking analytics on your Twitter dashboard.
10. Posting Timing
People often search “What is the best posting time to maximize engagement rate?”
The best time for posting on Twitter is to check when you are receiving the maximum views and impressions. This shows the time when your followers or users are engaging most actively with your post. You can create a posting schedule based on these metrics.
You can find the above time metrics on your Twitter exported Spreadsheet.

